
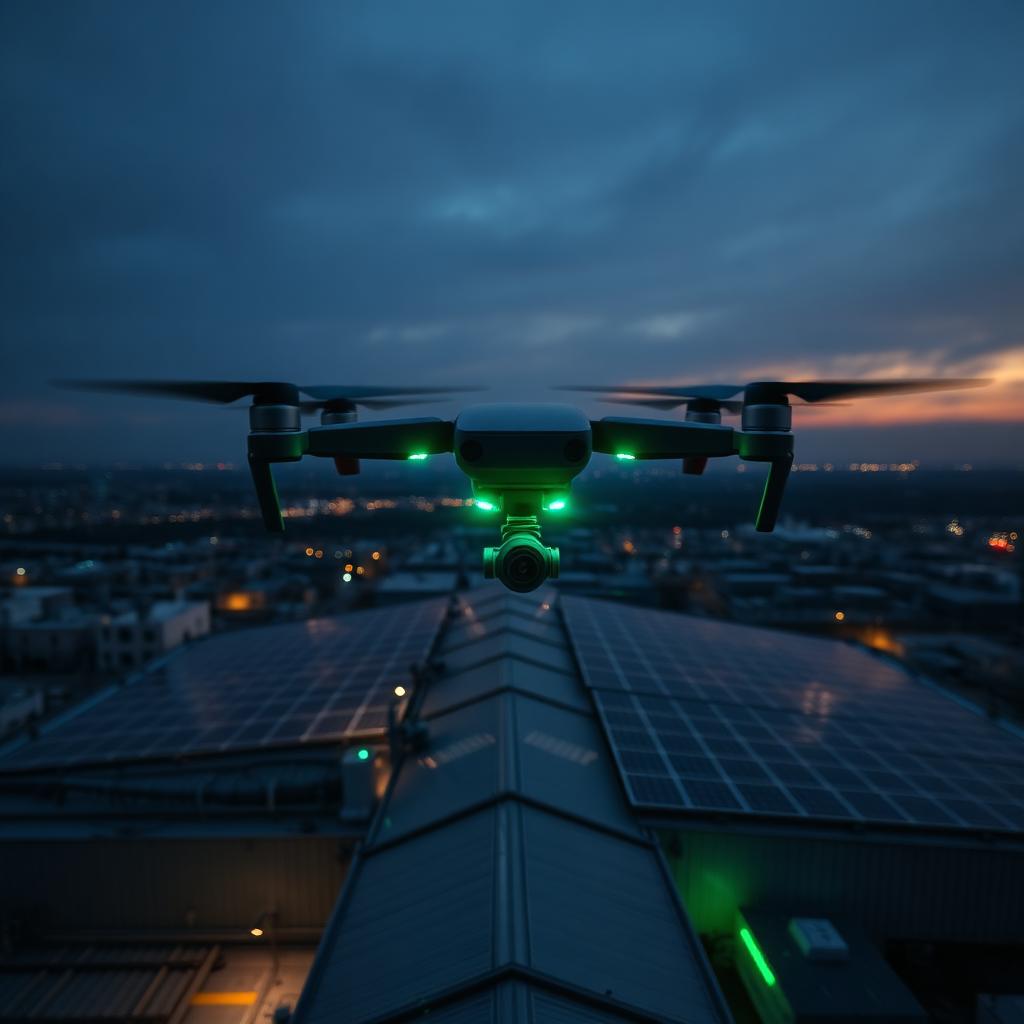
See what the eye cannot see.
Radiometric thermal imaging inspections with professional drones. From defective solar cells and heat leaks to overheated electrical installations — we map every anomaly precisely, documented according to the applicable inspection standards.
Six applications, one technology.
From residential installations to industrial parks — the same sensor, always perfectly calibrated for the job.
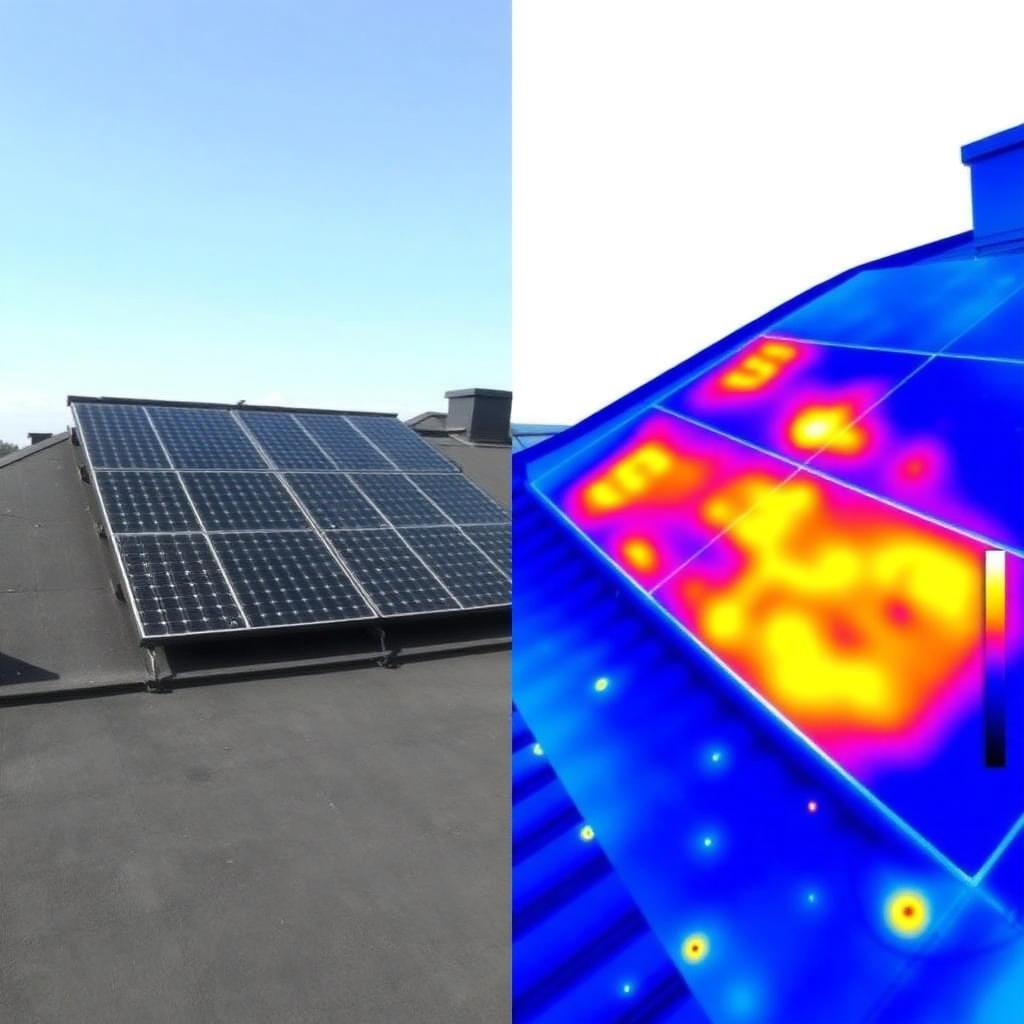
A single defective cell can bring down an entire string.
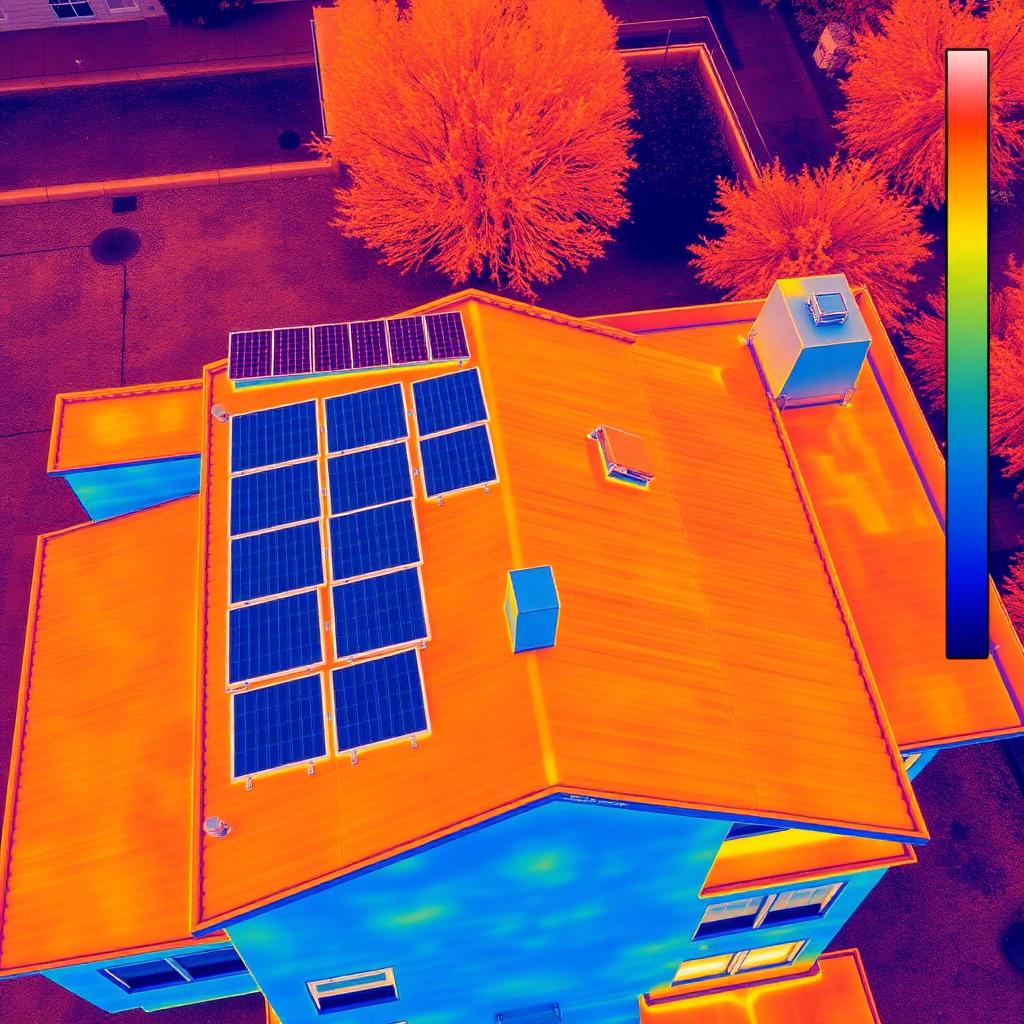
PV installations lose on average 1–3% of their yield each year due to unnoticed defects. Our thermographic inspection images every panel individually and detects hotspots, defective bypass diodes and loose connectors — often before they show up in the inverter data.
- Detection of hotspots, PID, LID and microcracks
- ΔT measurement per cell in line with IEC TS 62446-3
- Geolocation of every defective panel in the array
- Meets warranty and insurance requirements
Every anomaly has its own thermal signature.
We classify defects by type, ΔT and urgency — so you know instantly what needs fixing today and what you can monitor.
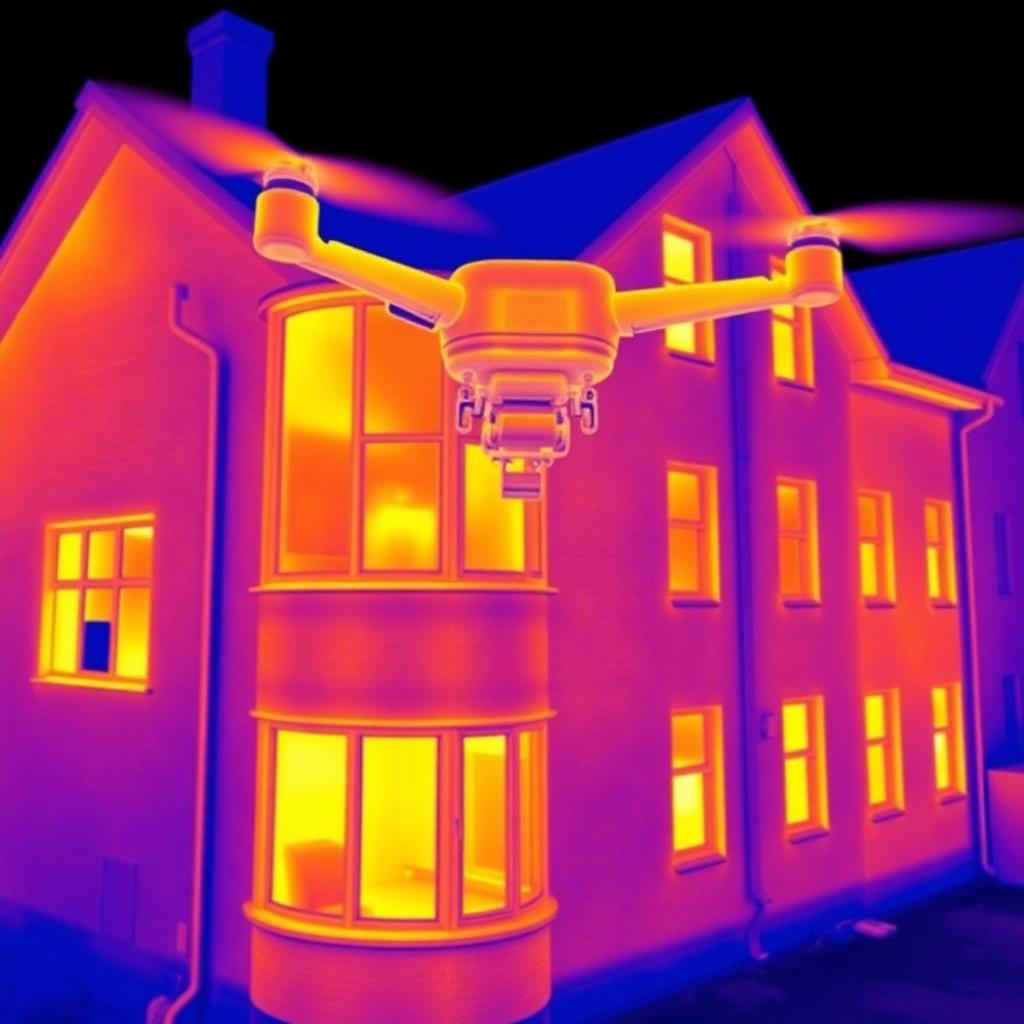
Heat escapes through places you'd never expect.
A poorly insulated building loses up to 40% of its heat through cold bridges, missing insulation, leaking windows and damp zones. Thermography literally puts colour on those losses — perfect for energy audits, EPC dossiers and renovation decisions.
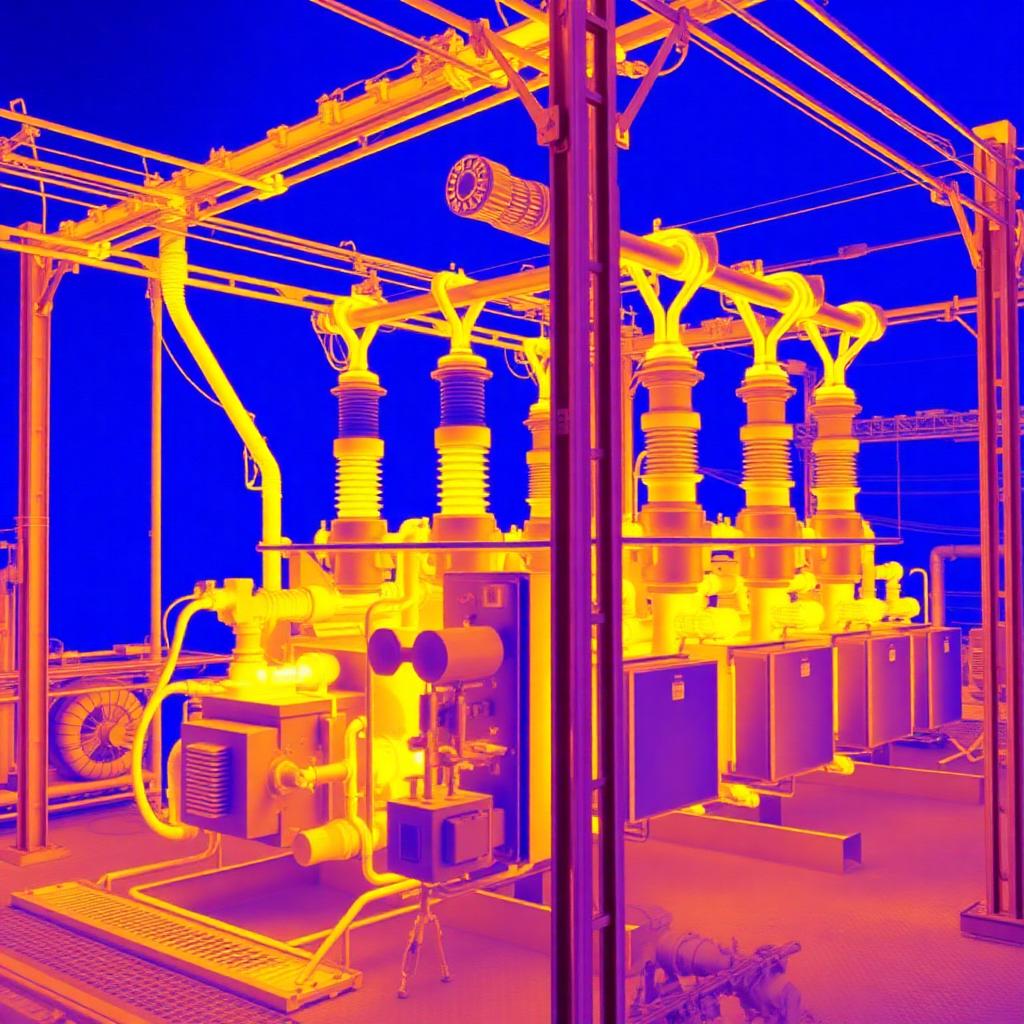
Predictive maintenance, without production loss.
Motors, bearings, electrical cabinets and process systems heat up before they fail. A periodic thermographic scan detects those anomalies in time — without shutting down the installation and without putting people at height or near live components.
Six steps, from intake to digital dossier.
- 1Intake & objectiveYou provide us with the type of installation, surface area and reason (yield loss, warranty, energy audit, maintenance).
- 2Timing & conditionsWe plan at the right time: PV requires >600 W/m² irradiance, buildings require a temperature difference of at least 10°C.
- 3Flight & captureCertified pilot flies a fixed grid with a calibrated radiometric camera — RGB and thermal simultaneously.
- 4Radiometric analysisEvery pixel contains a temperature value. Our analyst marks anomalies by severity class.
- 5Digital reportPDF dossier with thermal and visible imagery, ΔT measurements, GPS coordinates and concrete advice per defect.
- 6Follow-upAfter repairs, we optionally carry out a follow-up measurement to validate the fix.
Drone thermography vs. manual measurement
Traditional thermography from the ground or with a lift is slow, incomplete and expensive per MWp. From the air we measure an entire array in a single session.
A radiometric report, not loose photos.
Every defect is documented with exact temperature measurements, GPS location, RGB reference image and concrete advice — ready to forward to your installer, insurer or maintenance partner.
- Radiometric images per zone or panel array
- Side-by-side RGB and thermal images
- Overview map with GPS location of each defect
- ΔT measurements and severity classification per anomaly
- Concrete advice: repair, replacement or monitoring
- Report compliant with IEC TS 62446-3 and EN 13187
What you often want to know before a thermographic inspection.
When is the best time for a thermographic PV inspection?
For solar panels we require at least 600 W/m² irradiance — that means sunny days from March to September, between 11am and 3pm. For buildings we work the other way round: preferably in winter, early morning or evening, when the temperature difference between inside and outside is greatest.
How long does an inspection take?
A residential installation: 20–40 minutes on site. An SME roof with 200–500 panels: 1 to 2 hours. A 1 MWp solar park: usually completed in a single morning.
What's the difference with a regular infrared camera?
Our drones carry radiometric sensors: every pixel contains an absolute temperature value we can later analyse and document. A traditional handheld camera from the ground lacks detail and shows no exact measurements per cell.
Can I use the report for warranty or insurance purposes?
Yes. Our reports comply with IEC TS 62446-3 (solar panels) and EN 13187 (buildings) — the standards accepted by manufacturers and insurers for warranty claims.
Do I need to prepare my PV installation or building?
PV: the installation must be in production during the flight (not switched off). Buildings: heating/cooling must run constantly for at least 24h beforehand. We provide a short checklist upon confirmation.
Do you work throughout Belgium?
Yes. Standard travel is included within 15 km of Geraardsbergen. Beyond that, we charge a limited mileage fee — always communicated in advance.
Make heat losses visible — before they cost you money.
Request your no-obligation quote. We'll send you a tailored proposal for your installation or building within 24 hours.